A skill that we all need in modern day life is to avoid being tricked. Often people that are selling products or ideas will try and trick you using Statistics.

Advertisers know that the typical consumer (that's you and me) can get tricked. The more complicated the data the trickier it gets.
With the election campaign happening every three years in New Zealand it is very common for politicians to try and trick voters...

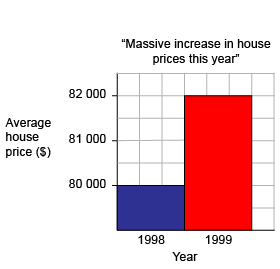
 Take some time to look at this graph. Can you see what is not right about this? What was trying to be achieved here? Who do you think created this graph/advertisement?
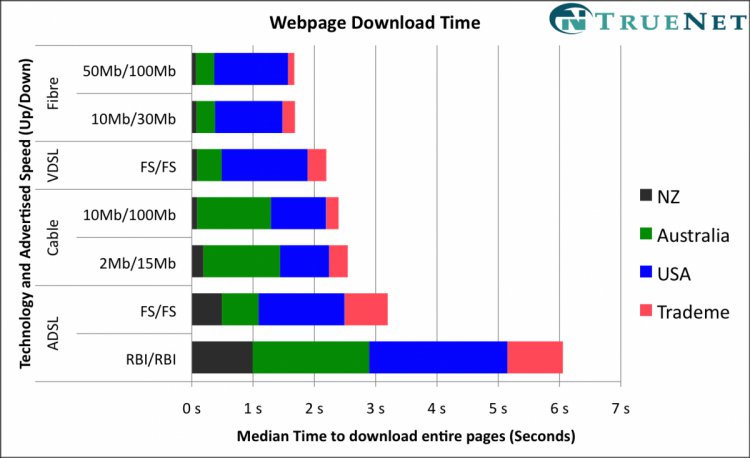
Here is another... this shows you how complicated data can hide some silly ideas. Can you see the trick here?
Now we can work from the textbook - page 392 to 394 this is on reading data tables or some pie graphs.
No comments:
Post a Comment