Here is that booket.
I know that students that can say "I really want to have a job in ? business" are way more likely to do better in school. That is they're more likely to see reason for work in class and strive to get better grades.
Thursday, November 27, 2014
Monday, November 24, 2014
Relief Lesson & Games
Decimal Conversion to Fraction
The trick with converting decimals is to know the smallest 'place value' and making that the bottom of the fraction (denominator).
Review on Place Value
For the number 45,268.137
The trick with converting decimals is to know the smallest 'place value' and making that the bottom of the fraction (denominator).
Review on Place Value
For the number 45,268.137
- The four is in the tens of thousands
- The five is in the thousands
- The two is in the hundreds
- The six is in the tens
- The eight is in the ones (units)
- The one is in the tenths (as in fraction over ten)
- The three is in the hundredths (as in fraction over one hundred)
- The seven is in the thousandths (as in fraction over one thousand)
Another way to say this number is "forty five thousand, two hundred and six eight and 137/1000"
Here are some online games that practice this...
Fruit Shooting - ok game good practice. Lots of levels to choose from.
Puppy Chase - make the dog run (I got second when I tried it).
Jump Stones Over River - this tests out if you know your decimals
Balance the Scales - not so much a game but good to play with for few mins
Tuesday, November 18, 2014
Monday, November 17, 2014
Fractions
Fractions
Visual - Representative.
Fractions are things that confuse heaps of students... lots get through without ever really knowing what they're all about. I always think about fractions with my stomach. I think of bars of chocolate (cause they're rectangles) or cakes (cause they're round).
 The key things you need to know is that they're parts of wholes. They lie between the numbers on a number line...
They don't always have to be between 0 and one (e.g. you can have 'three and a half'.
Class activity - competition to see where a fraction of a line is on the whiteboard (some rewards up for grabs).
Here is a link to a fraction shooting game (quite good fun). Post a reply of your high score. Set the timer on this one
This link is for one you need headphones for - it's about seeing what fraction is bigger. Do this one for about 10 minutes - it's a bit boring but you'll learn a valuable ability to identify size.
 Equivalent Fractions -
here is the link
This is when the fraction shows the same amount of a fraction but looks different. This is an interactive teacher led animation. You can see how the fractions are the equal (balanced) but have different numbers top/bottom. Other good learning here is the decimal on the bottom - you can use a calculator to find this (use the divided by button).
Here is a link to a game (bit boring but has levels of difficulty) - try to get through to level four.
Visual - Representative.
Fractions are things that confuse heaps of students... lots get through without ever really knowing what they're all about. I always think about fractions with my stomach. I think of bars of chocolate (cause they're rectangles) or cakes (cause they're round).
The key things you need to know is that they're parts of wholes. They lie between the numbers on a number line...They don't always have to be between 0 and one (e.g. you can have 'three and a half'.
Class activity - competition to see where a fraction of a line is on the whiteboard (some rewards up for grabs).
Here is a link to a fraction shooting game (quite good fun). Post a reply of your high score. Set the timer on this one
This link is for one you need headphones for - it's about seeing what fraction is bigger. Do this one for about 10 minutes - it's a bit boring but you'll learn a valuable ability to identify size.
Equivalent Fractions -here is the link
This is when the fraction shows the same amount of a fraction but looks different. This is an interactive teacher led animation. You can see how the fractions are the equal (balanced) but have different numbers top/bottom. Other good learning here is the decimal on the bottom - you can use a calculator to find this (use the divided by button).
Here is a link to a game (bit boring but has levels of difficulty) - try to get through to level four.
Tuesday, November 11, 2014
Rest of Year Plan
Planning
We will finish off our Probability Unit with the test next week (Monday period three).
The remainder of the year will be on Fractions - Decimals - Percentages and general revision of all the topics we've covered this year.
Week Six
Monday 3 - Prob test
Tuesday 3 - Test returned and outline of the final topic.
Wednesday 2 -
Thursday 1 -
Week Seven
Tuesday 3 -
Wednesday 3 -
Thursday 2 -
Friday 1 -
Week Eight
Wednesday 3 -
Thursday 3 - Activity Week (movie or paintball).
Friday 2 - On Homunga Walk
Week Nine
Monday 1 - Fraction/Decimal/% test.
Thursday 3 - Gaming day.
Friday 3 - Test return (then general maths fun).
Week Ten
Monday 1 - Last period of maths this year.
Wednesday - Year 9 & 10 Prizegiving in the morning.
Thursday, October 30, 2014
Probability Post Two
Online Probability Apps.
Here are a couple of YouTube videos that may help you're understanding. (Headphones needed)..
Here are list of good games or apps that will help with your understanding of probability...
Using the Words like "Certain" click here.
Ten problem test on works click here.
Card game probability challenge click here.
Falling ball simulation click here.
The difference between theoretical and experimental probabilities.
Theoretical - theory - in the head - idea.
Experimental - from the past experiment.
The idea you need to know is that with time experiment will become theoretical. The probabilities will match. e.g. flipping a head (should be 50%)... There are two sides on a coin one is a head therefore in theory it's 1/2 chance.
The proper notation is to save time. P(head) = 0.5 this means "the probability of a head is 50%"
Card Games - we think no jokers so 52 cards. Four suits (hearts/clubs/spades/diamonds). Picture cards (king/queen/jack).
Monday, October 20, 2014
Remainder of The Year
Well Done on the Statistics Topic
Statistics is really an avenue of learning in Maths that can take you right through to NCEA Level Three (and it's all focussed upon that PPDAC cycle).
Our next topic is going to be looked at through the topic of the Ocean (our ocean is the pacific ocean). There are several ways that we can look at probability through the Ocean (the chance of catching a fish, the probability of big waves, the chance of finding pirate treasure).
Probability is a nice small unit. It is one of my favourite areas to learn. You will be a wiser more 'on-to-it' person if you understand probability.
We begin with talking about the future and how things in the future we don't know.
We then move into the simple chances of dice, coins, spinners.
Then we move into the real world of probability looking at really complex things and seeing what chances are that events will happen.
Probability Vocabulary List.
Conditional
Probability - The probability of an event assuming that another has occurred.
Expected
Number - The expected number is the probability times the number of
trials. E.g. how many heads would you
expect from flipping a coin thirty times.
Expected number = 0.5 x 30 = 15 heads.
Events – The observed result
over time. Assigned a number (between 0
and 1) or word. E.g. 0 is “impossible”,
1 is “certain”, 0.5 is “equally likely/unlikely” etc.
Experimental
Probability - The calculation of probability through observation over time. The formula is P(event) = #event happen/#trials.
Notation
– The
correct mathematical way of setting out probability. E.g. the chance that the coin will be a head
is presented P(head) = 0.5. We use
fractions and decimals for probability not ratios.
Odds - A gambling term for a
comparison of probabilities.
Probability – The mathematical way of describing the likelihood of
events in the future.
Probability Tool – These include coins, dice, random spinners, names
out of a hat and random number generators (on your calculators).
Simulation – A simulation is where mathematicians take real life
future events and assign probabilities to them (and a tool to calculate). Then taking these future events combine them
over many experiments to give an overall probability. Use of
tables and spreadsheets help.
Theoretical Probability – Finding the chance through
logic/knowledge not experiment.
Tree Diagrams – A theoretical approach to present probabilities in a
branch structures.
Venn diagram - A box type diagram used to show sets.
Probability Post One
Intro To Probability
 Probability is the study of the future – it works out the chance of things happening.
The future is uncertain so we have to use our knowledge (theoretical – probability) to calculate the chances.
 We use numbers to show the chance of
something happening in the future…
We use numbers to show the chance of
something happening in the future…
Probability is given in fractions or decimals (no % in test situations).
e.g. The probability that the AB’s will beat South Africa in the next game is…0.7 (or 7/10).
Probability only works for the
future as things are not already determined.
Think about the next rugby world cup.
The future is uncertain so we have to use our knowledge (theoretical – probability) to calculate the chances.
Probability is given in fractions or decimals (no % in test situations).
e.g. The probability that the AB’s will beat South Africa in the next game is…0.7 (or 7/10).
Tuesday, October 14, 2014
Statistics Checklist
End of Topic
With our test coming up period one here is some final revision material. Copy handed out in class.
Remember for the test you'll need to have great graphing skills - straight edges with rulers, protractor (for pie graph) and a rubber to do any corrections.
Remember that you can use a calculator (it will be way easier to find the mean or the size of the angle on the pie graphs).
Sunday, September 21, 2014
Practice Statistics Graphs
Some Practice Materials...
Here are two worksheets that are close to the test (remaining 50% of the unit).
Sorry I've got a sick daughter and can't make it in for your presentations today - will do these next lesson.


Monday, September 15, 2014
Second Half Statistics Topic
The remainder of the term...
We have the election results as a focal point for the next two weeks. An election is really a census of the entire population of the voting public (over 18 years old).
The final 50% of your grade will be from a test/assessment done over one hour. This part of the topic will be done solo (as opposed to your presentation done in pairs).
The specific things that you have to be able to do are...
You are allow a calculator but not the computers for this part of the topic.
We have the election results as a focal point for the next two weeks. An election is really a census of the entire population of the voting public (over 18 years old).
The final 50% of your grade will be from a test/assessment done over one hour. This part of the topic will be done solo (as opposed to your presentation done in pairs).
The specific things that you have to be able to do are...
- Put raw data (in a random order) into a stem and leaf graph. This may be sorted or unsorted. This may be a back to back stem and leaf graph.
- Calculate from stem n leaf graph the measures of the centre (mean/median/mode) and the spread (range and interquartile range).
- Use the PPDAC cycle of inquiry (know what happens when and why it happens).
- Draw box n whisker graphs carefully in grid paper (using a ruler and correct scale/sizes).
- Read graphs to get information (histogram/pictograph/bar/pie/box n whisker).
You are allow a calculator but not the computers for this part of the topic.
Sunday, September 14, 2014
PPDAC For The Movies
PPDAC Inquiry Summary
Now that you've had enough time to look at the database of movies from 2012 and 2013 it is important for you to consider the bigger picture idea of inquiry.
 So owners of movie theatres are very interested in what movies are coming up. The term "blockbuster" is great it means lots of people going to the movies and more $$ for the owners.
So the initial investigation would be on assessing which year was better or if things are getting better or worse?
Remember that you presentation will need to have some slides that cover all of the PPDAC sections.

Now that you've had enough time to look at the database of movies from 2012 and 2013 it is important for you to consider the bigger picture idea of inquiry.
So owners of movie theatres are very interested in what movies are coming up. The term "blockbuster" is great it means lots of people going to the movies and more $$ for the owners. So the initial investigation would be on assessing which year was better or if things are getting better or worse?
Remember that you presentation will need to have some slides that cover all of the PPDAC sections.
·
Problem – I will give this to you "I wonder if 2013 was a better year
financial at the box office for movies". You can make
a prediction which year you think might be better just looking at the databases.
·
Plan – I got it from a website called box
office mojo. There was way more than 100 movies but I picked the
top 100 - but I choose to limit to the top 100.
·
Data – Explain how you picked your sample. What is good about the size of the sample you choose. Also note that the data is in US dollars and rounded to the nearest million
dollars.
·
Analysis – You have to find statistics like the middle
(mean/median/mode) the spread (range and interquartile
range). You have to have some graph(s) Box n
Whisker and/or Back
to Back Stem n Leaf
Box n Whisker Generator
Creating Accurate Box n Whisker Graph
I found a site that will generate the graph for you.
It is a really important graph to know what is happening (but given this is a presentation on slides this is the best option).
Here is the link (Americans call box n whisker graphs - boxplot graphs).
The website will generate one graph at a time that will look like this...
 It is important that when you do your second graph that you go from zero upto the maximum value of either year (so that they are the same scale).
You may also need to use the snipping tool
here is a YouTube clip of how to use snipping tool (I use this all the time)...
I found a site that will generate the graph for you.
It is a really important graph to know what is happening (but given this is a presentation on slides this is the best option).
Here is the link (Americans call box n whisker graphs - boxplot graphs).
The website will generate one graph at a time that will look like this...
You may also need to use the snipping tool
here is a YouTube clip of how to use snipping tool (I use this all the time)...
Movie PPDAC Inquiry
Sampling Avoiding Bias
There are too many movies here for us to process. We need to pick a smaller sample so we can easily find the measures of the middle and the spread of the data.
 So how do we pick our sample? Answer we choose randomly. Technically random means every part of the population has an equal chance of being picked.
Here is how to do a random sample. Give every part of the population a number (the movies are numbers 1 to 100 already).
Use a random number generator (10 sided dice will do this - first roll is the tens and the second roll for the ones).
Here is a link to a random number generator online.
Here is an online ten diced dice roller. It is showing two dice a two and a three meaning the number 23 (on the movie database for 2013 that's the movie Evil Dead which raised $54 million dollars).
 Question - Can we double count? If the random number 23 came up again should we have Evil Dead appear in our sample twice? Answer - No we just ignore the repeat. It catches out students because they often forget to replace the ignored one.
We are aiming to have a big enough sample to be more accurate (too small and it can lead to bad conclusions).
Recording our Data - It takes a long time to write out the names of the movies. So instead to show our selection just use a highlighter to help you remember which ones you picked. That way the only things we have to use in the calculator (or spreadsheet) are the actual numbers.
There are too many movies here for us to process. We need to pick a smaller sample so we can easily find the measures of the middle and the spread of the data.
So how do we pick our sample? Answer we choose randomly. Technically random means every part of the population has an equal chance of being picked. Here is how to do a random sample. Give every part of the population a number (the movies are numbers 1 to 100 already).
Use a random number generator (10 sided dice will do this - first roll is the tens and the second roll for the ones).
Here is a link to a random number generator online.
Here is an online ten diced dice roller. It is showing two dice a two and a three meaning the number 23 (on the movie database for 2013 that's the movie Evil Dead which raised $54 million dollars).
Question - Can we double count? If the random number 23 came up again should we have Evil Dead appear in our sample twice? Answer - No we just ignore the repeat. It catches out students because they often forget to replace the ignored one.We are aiming to have a big enough sample to be more accurate (too small and it can lead to bad conclusions).
Recording our Data - It takes a long time to write out the names of the movies. So instead to show our selection just use a highlighter to help you remember which ones you picked. That way the only things we have to use in the calculator (or spreadsheet) are the actual numbers.
Thursday, September 11, 2014
Presentation Mark Scheme
Mark Scheme
Here is where I will be allocating marks (50% of this topic's grade). The other 50% is on a end of topic test.
Communicating your thinking clearly (that you've appreciated that the results will vary).
Max mark 3. Looking at the words on your presentation under each PPDAC heading
(you don't have to deviate much from the examples I've posted earlier).
Working well with your time (avoiding any last min rush jobs).
Max mark 3. You've been onto the work (not just filling in time).
Presentation (make it good).
Max mark 2.
Use of the PPDAC headings in your presentation (see below for more hints).
Max mark 1 (if you have you get this)
Mistake free working (showing working out).
Max mark 1 (if you show working you get this).
Teamwork (not just relying on one person).
Max mark 1 (if your class presentation is shared equally you get this - no just one person talking).
Thinking outside the square (big picture ideas).
Max mark 1 - if I can see that there.
Total of 12.
Hope this helps. Presentations start on Monday.
Movie Sub Topic
Which Year Was The Best For Movies
The next step in our statistics unit is to think about how we sample from a population. For this I am going to supply you with a database of the top 100 grossing (that means $$$) films of two years 2012 and 2013.
The key learning is...[the words in red are words that are vital to know/use]
Here is a copy of the list that of the top 100 for each year (it goes on two pages). I've put them into alphabetical order. The numbers I've rounded to the nearest one hundred million dollars to put the value of these in perspective the entire NZ economy for 2013 was worth US$180 million dollars so that means a movie like Ice Age : Continental Drift was worth nearly as much as the entire NZ economy!.

The next step in our statistics unit is to think about how we sample from a population. For this I am going to supply you with a database of the top 100 grossing (that means $$$) films of two years 2012 and 2013.
The key learning is...[the words in red are words that are vital to know/use]
- We often have too many numbers to deal with - so we pick a smaller sample from the population. This is called sampling.
- Sampling can easily cause bias (remember b.s.) so we have to be fair in picking. We can be fair by choosing randomly.
- We still look to 'clean' any data - is there clearly an error in there. FYI there isn't in this database I've given you.
- We are still focussed on the PPDAC inquiry cycle.
Here is a copy of the list that of the top 100 for each year (it goes on two pages). I've put them into alphabetical order. The numbers I've rounded to the nearest one hundred million dollars to put the value of these in perspective the entire NZ economy for 2013 was worth US$180 million dollars so that means a movie like Ice Age : Continental Drift was worth nearly as much as the entire NZ economy!.
Tuesday, September 2, 2014
Inquiry Post Update
PPDAC On Ford v Holden
Guys - I'm away again today and tomorrow with some deputy principal jobs that I've got to have done. I'm a bit worried about where you're at with your projects - this post is hopefully going to have you back on track...
PPDAC
A for Analysis... this is where you need to be processing your 30 numbers for the Holdens and 30 numbers for the Fords. The main things that I need for you to have done are...
 Stem and Leaf Graphs for the numbers... e.g. this graph shows some car odometers (how many kms travelled). You can see that we're talking about 1000's of km. So the top car has 159,000km on the 'clock' and there are three cars that have all travelled 190,000's of distance.
[I would recommend rounding of big numbers to the nearest 1000]
The next calculations that you will need will be the measures of the middle.
Mean = total/number = (159 + 162 + 168 + 173 ... + 193) / 15 = ???
Median = very middle number = 180,000km
Mode = most common (in my stem n leaf graph there is one mode) = 173,000
The next calculation is the spread
Range = highest - lowest = 193 - 159 = 34,000km
Then you need to find the upper and lower quartiles.
note - this is worthy of your time - it is the most technical part of the PPDAC cycle. You can find extra support examples of this further down these posts.
The Graph(s)
You can do some histograms (bar graphs with no gaps)...
Guys - I'm away again today and tomorrow with some deputy principal jobs that I've got to have done. I'm a bit worried about where you're at with your projects - this post is hopefully going to have you back on track...
PPDAC
A for Analysis... this is where you need to be processing your 30 numbers for the Holdens and 30 numbers for the Fords. The main things that I need for you to have done are...
Stem and Leaf Graphs for the numbers... e.g. this graph shows some car odometers (how many kms travelled). You can see that we're talking about 1000's of km. So the top car has 159,000km on the 'clock' and there are three cars that have all travelled 190,000's of distance.[I would recommend rounding of big numbers to the nearest 1000]
The next calculations that you will need will be the measures of the middle.
Mean = total/number = (159 + 162 + 168 + 173 ... + 193) / 15 = ???
Median = very middle number = 180,000km
Mode = most common (in my stem n leaf graph there is one mode) = 173,000
The next calculation is the spread
Range = highest - lowest = 193 - 159 = 34,000km
Then you need to find the upper and lower quartiles.
note - this is worthy of your time - it is the most technical part of the PPDAC cycle. You can find extra support examples of this further down these posts.
The Graph(s)
You can do some histograms (bar graphs with no gaps)...
Tuesday, August 26, 2014
Google Chrome Presentation Instructions
How to use...
This doesn't look to dissimilar to PowerPoint. Being new to google presentation it took me a few mins to get use to it - but this video helped me greatly...
There were more youtube clips that I found useful - but for your presentation we don't need to get too technical.
It is more important to have good PPDAC details than to make it look fancy.
Do seek extra help if you need it.
Monday, August 25, 2014
Hints on Statistics Inquiry
OK Review Of Where You're At
In your pairs now you should have taken some time to think about how to approach this idea of whether Holden or Ford owners *love* their cars more.

I've deliberately picked the word love as it's means different things to different people (and therefore you may have different ways of approaching your inquiry). This is fair too as Statisticians get paid to work for clients and sometimes those clients will ask for things that aren't too specific.
 I'm expecting that you've began to give some definitions (spelling out exactly what you're doing). There are some key things to cover - who/what/where/when. I.e. if you data comes from Trademe Website - you need to state this. If you're looking at price there are several to go from (current bid, reserve price, buy now price, 'or nearest offer' price). You need to specify these - justify which one you're picking.
 I'm also expecting that you've been looking at the data - how much is there? How many XR6's are advertised? Can you use all of these? If too many you will need to sample (pick a few) - how are you going to do this (spell it out in your presentation)?. How does this compare with the Commodores? Are all the XR6's the same (if not why not) - how are you accounting for these? This is an important aspect of the PPDAC cycle as if your data is bias from the start it will lead to bad conclusions.
You want to think about your overall presentation (I'm thinking most pairs will do a PowerPoint - but that is not necessary the case). Try to balance your time - don't get sucked into spending too much on making things pretty and sacrifice your actual processing time.
From here you should start to think about finding the measures of the middle (mean, median, mode) and the measures of spread (range, upper and lower quartiles).
In your pairs now you should have taken some time to think about how to approach this idea of whether Holden or Ford owners *love* their cars more.
I've deliberately picked the word love as it's means different things to different people (and therefore you may have different ways of approaching your inquiry). This is fair too as Statisticians get paid to work for clients and sometimes those clients will ask for things that aren't too specific.
I'm expecting that you've began to give some definitions (spelling out exactly what you're doing). There are some key things to cover - who/what/where/when. I.e. if you data comes from Trademe Website - you need to state this. If you're looking at price there are several to go from (current bid, reserve price, buy now price, 'or nearest offer' price). You need to specify these - justify which one you're picking. I'm also expecting that you've been looking at the data - how much is there? How many XR6's are advertised? Can you use all of these? If too many you will need to sample (pick a few) - how are you going to do this (spell it out in your presentation)?. How does this compare with the Commodores? Are all the XR6's the same (if not why not) - how are you accounting for these? This is an important aspect of the PPDAC cycle as if your data is bias from the start it will lead to bad conclusions. You want to think about your overall presentation (I'm thinking most pairs will do a PowerPoint - but that is not necessary the case). Try to balance your time - don't get sucked into spending too much on making things pretty and sacrifice your actual processing time.
From here you should start to think about finding the measures of the middle (mean, median, mode) and the measures of spread (range, upper and lower quartiles).
Sunday, August 24, 2014
Statistics Inquiry
PPDAC Inquiry In Pairs
You have to come up with a logical approach and conclusion (using the PPDAC cycle) to the following idea...
I want to know if Holden Commodores or Ford XR6's are really loved more by their owners.
Problem (was given last post)
Plan - In your pairs you have to come up with some definitions...
Analysis - Finding the mean, median, mode, range, upper and lower quartiles. Doing some graphs - box n whiskers, maybe scatterplot, maybe bar graph.
Conclusion - you will need to make a presentation (poster or powerpoint) to the rest of the class which will answer whether owners love Holdens or Fords more.
Marks will be allocated for...

You have to come up with a logical approach and conclusion (using the PPDAC cycle) to the following idea...
I want to know if Holden Commodores or Ford XR6's are really loved more by their owners.
Problem (was given last post)
Plan - In your pairs you have to come up with some definitions...
- How will you know you're comparing fairly (ie not all old Fords versus new Holdens)?
- How will you quantify the "love" (this is possible to do sort of).
- How will you find your data?
- What will your data be (discrete/counted or continuous/measured)?
- How many pieces of data will you need?
Analysis - Finding the mean, median, mode, range, upper and lower quartiles. Doing some graphs - box n whiskers, maybe scatterplot, maybe bar graph.
Conclusion - you will need to make a presentation (poster or powerpoint) to the rest of the class which will answer whether owners love Holdens or Fords more.
Marks will be allocated for...
- Communicating your thinking clearly (that you've appreciated that the results will vary).
- Working well with your time (avoiding any last min rush jobs).
- Presentation (make it good).
- Use of the PPDAC headings in your presentation (see below for more hints).
- Mistake free working (showing working out).
- Teamwork (not just relying on one person).
- Thinking outside the square (big picture ideas).
Wednesday, August 20, 2014
Statistics Post 9
The Range
The range is the most basic measure of the spread of data. It shows how consistent the data is.
When we look at the data from our dart throwing...

We can see that although Paea's average (aka mean) was the highest he was not consistent in his scores. The range is like the measure of consistency.
In our data Baylees Range is 18 - 4 = 14, Jordan is 17 - 3 = 14, Paea is 60 - 5 = 55, Pierce is 14 - 5 = 9, Finn is 50 - 0 = 50 and Josh was 26 - 1 = 25.
A way of thinking about range is to think about a tank firing a shell.
The shell will go between the longest/greatest distance (several km) to it's shortest distance (about 50m). So the range is the difference between those two numbers (it's where the shell can land).
Quartiles
The second major measure of the spread of the data is to know about the Upper and Lower Quartiles. The names gives you the hint - quarters (25%).
To find the quartiles we have to...
Step One - Have the data all in order (lowest to highest).
Step Two - Find the halfway (median aka middle).
Step Three - Find the halfway of the bottom half of data (Lower Quartile).
Step Four - Find the halfway of the top half of the data (Upper Quartile).

 Quartiles lead us into a major important graph called the Box and Whisker Graph. This is the A in PPDAC (the analysis).
Box n Whisker Graphs allow us to compare two similar pieces of data.
E.g. Holden Commodore vs Ford XR6's
Which Vehicle will last the longest before it's time to get rid of it?
PPDAC
P - Problem
P - Plan
D - Data
A - Analysis
C - Conclusion
What would be a good way to investigate which of these vehicles will last the longest before it's time to get rid of it?
The range is the most basic measure of the spread of data. It shows how consistent the data is.
When we look at the data from our dart throwing...
We can see that although Paea's average (aka mean) was the highest he was not consistent in his scores. The range is like the measure of consistency.
Technically the Range is = Highest minus Lowest.
In our data Baylees Range is 18 - 4 = 14, Jordan is 17 - 3 = 14, Paea is 60 - 5 = 55, Pierce is 14 - 5 = 9, Finn is 50 - 0 = 50 and Josh was 26 - 1 = 25.
A way of thinking about range is to think about a tank firing a shell.
The shell will go between the longest/greatest distance (several km) to it's shortest distance (about 50m). So the range is the difference between those two numbers (it's where the shell can land).
Quartiles
The second major measure of the spread of the data is to know about the Upper and Lower Quartiles. The names gives you the hint - quarters (25%).
To find the quartiles we have to...
Step One - Have the data all in order (lowest to highest).
Step Two - Find the halfway (median aka middle).
Step Three - Find the halfway of the bottom half of data (Lower Quartile).
Step Four - Find the halfway of the top half of the data (Upper Quartile).
Quartiles lead us into a major important graph called the Box and Whisker Graph. This is the A in PPDAC (the analysis). Box n Whisker Graphs allow us to compare two similar pieces of data.
E.g. Holden Commodore vs Ford XR6's
Which Vehicle will last the longest before it's time to get rid of it?
PPDAC
P - Problem
P - Plan
D - Data
A - Analysis
C - Conclusion
What would be a good way to investigate which of these vehicles will last the longest before it's time to get rid of it?
Sunday, August 17, 2014
Statistics Post 8
Measures of a Spread
There are two main things we need to understand about comparing two things (using data). The middle we've covered (mean/median/mode). The spread is also very important.
e.g. Score from two players in darts (three darts each).

Here is a simulator that we want to get some scores (this we'll use as our data) from you guys for...
http://www.teamopolis.com/play-sports-games-online/default.aspx?GameID=50
Turf Table Champion Score...
Middle Table Champion Scores...
Courtyard Table Champion Scores...
This is the results from our six champions...

There are two main things we need to understand about comparing two things (using data). The middle we've covered (mean/median/mode). The spread is also very important.
e.g. Score from two players in darts (three darts each).
Here is a simulator that we want to get some scores (this we'll use as our data) from you guys for...
http://www.teamopolis.com/play-sports-games-online/default.aspx?GameID=50
Turf Table Champion Score...
Middle Table Champion Scores...
Courtyard Table Champion Scores...
This is the results from our six champions...
Statistics Post 7
Summary of Learning
We have now covered the following materials...
Data - numbers
Counted Data - no decimals (aka discrete data)
Measured Data - yes decimals (aka continuous data).
Cleaning the Data - write it down (delete and replace later).
Bias Data - incorrect by intent or accident (aka b.s. data).
Inquiry Cycle - PPDAC (thinking about the logical approach to an investigation)
Measure of the Middle - mean/median/mode
Mean = total/#counted (divide because the teacher is "mean").
Median = Middle in order (think the eyes "i's").
Mode = Most common.
Stem n Leaf Graph - shows all the data. (can be sorted or unsorted).
Extension Double sided Stem and Leaf Graph.
Tuesday, August 12, 2014
Statistics Post 6
Stem and Leaf and Middle Measures.
Today we're going to get into the basics of finding the middle of any data set.
For this lesson we're going to look at counted data (discrete).
Here is a copy of the power point of notes.
The key learning [WALT] is to know the three measures of the middle. And to also know what a "Stem and Leaf" graph looks like.

Here is the idea of stem and leaf...
you can see the stem up the middle (getting bigger and bigger) and the leaves coming off the sides (extension work is the idea of both sides coming off the middle numbers).

This is what they look like in maths...
The practice work is in the text book on pages 407 to 409 Exercise 28.7.
here is an online video for these stem and leaf plot (you need head phones for this)...
http://www.mathplayground.com/howto_stemleaf.html
Here is a link to an online game/tester for this content...
https://www.mangahigh.com/en-gb/maths_games/data/representing_data/stem_and_leaf_diagrams
Here is another link to the same type of materials...
http://www.mathsisfun.com/data/stem-leaf-plots.html
Here is one more online tester too...
http://www.ixl.com/math/grade-5/stem-and-leaf-plots
Today we're going to get into the basics of finding the middle of any data set.
For this lesson we're going to look at counted data (discrete).
Here is a copy of the power point of notes.
The key learning [WALT] is to know the three measures of the middle. And to also know what a "Stem and Leaf" graph looks like.
Here is the idea of stem and leaf...
you can see the stem up the middle (getting bigger and bigger) and the leaves coming off the sides (extension work is the idea of both sides coming off the middle numbers).
This is what they look like in maths...
The practice work is in the text book on pages 407 to 409 Exercise 28.7.
here is an online video for these stem and leaf plot (you need head phones for this)...
http://www.mathplayground.com/howto_stemleaf.html
Here is a link to an online game/tester for this content...
https://www.mangahigh.com/en-gb/maths_games/data/representing_data/stem_and_leaf_diagrams
Here is another link to the same type of materials...
http://www.mathsisfun.com/data/stem-leaf-plots.html
Here is one more online tester too...
http://www.ixl.com/math/grade-5/stem-and-leaf-plots
Thursday, August 7, 2014
Statistics Post 5
The Great Lake Fishing Competition
One of the very best weekends you can have fishing is an annual Trout fishing competition on Lake Taupo. It is called the "Open Trout Tournament" - anyone can enter.

 Today we're going to do our own fishing - I will bring along Lake Taupo in a can. There are literally thousands and thousands of fish in the lake/can. Each of you will *catch* a pinch full of some fish (some will catch more than others). You can find your own fishing spot (in the can) and fish there. Then we'll find out some results. There will be a prize for the best table/boat (the biggest fish and the biggest average).
The learning today is about Samples. A sample is technically a small part/subset of the population. Our sampling is random. Random means that every fish in the can has an equal chance of being caught. We have to shake the can each pick to better ensure it's random.
We are going to need a way of recording down our results for each boat. For this we need to have a grouped frequency table.
Here is a link to the results from this years competition - we can open it to see if our averages and biggest fish would have compared.
One of the very best weekends you can have fishing is an annual Trout fishing competition on Lake Taupo. It is called the "Open Trout Tournament" - anyone can enter.
Today we're going to do our own fishing - I will bring along Lake Taupo in a can. There are literally thousands and thousands of fish in the lake/can. Each of you will *catch* a pinch full of some fish (some will catch more than others). You can find your own fishing spot (in the can) and fish there. Then we'll find out some results. There will be a prize for the best table/boat (the biggest fish and the biggest average). The learning today is about Samples. A sample is technically a small part/subset of the population. Our sampling is random. Random means that every fish in the can has an equal chance of being caught. We have to shake the can each pick to better ensure it's random.
We are going to need a way of recording down our results for each boat. For this we need to have a grouped frequency table.
Here is a link to the results from this years competition - we can open it to see if our averages and biggest fish would have compared.
Wednesday, August 6, 2014
Statistics Post 4
Unit Plan
Here are the two main planning documents. The first one is the Statistics Unit in a way students can read it (a copy will be given to you to cellotape in your books). The second one is my general order of teaching.
Here are the two main planning documents. The first one is the Statistics Unit in a way students can read it (a copy will be given to you to cellotape in your books). The second one is my general order of teaching.
 |
| Copy given to students. |
 |
| My Teaching Order |
Statistics Post 3
Statistical Inquiry Cycle
 A very common thing for all people to know is how to compare groups. If I said which fish is bigger, snapper from Waihi or snapper from Whitianga? I would expect you to approach the problem in a systematic way.
We call this the "Statistical Inquiry Cycle" and it's summed up in the acronym PPDAC [you absolutely must learn this]. It is a way of approaching the answer correctly.
In statistics there rarely is the right answer. Say if we said the that average year 9 at Waihi College weighed 53.4kg. It would be very unlikely that the a randomly selected student would actually weigh 53.4kg.
PPDAC stands for...
A very common thing for all people to know is how to compare groups. If I said which fish is bigger, snapper from Waihi or snapper from Whitianga? I would expect you to approach the problem in a systematic way. We call this the "Statistical Inquiry Cycle" and it's summed up in the acronym PPDAC [you absolutely must learn this]. It is a way of approaching the answer correctly.
In statistics there rarely is the right answer. Say if we said the that average year 9 at Waihi College weighed 53.4kg. It would be very unlikely that the a randomly selected student would actually weigh 53.4kg.
PPDAC stands for...
- P roblem
- P lan
- D ata
- A nalysis
- C onclusion
 |
| The PPDAC Cycle |
Monday, August 4, 2014
Sheep Shooter
Here is a link to that website.
Remember that it will take years of training to get to my ninja (0.2162 seconds) level.
http://www.bbc.co.uk/science/humanbody/sleep/sheep/reaction_version5.swf

Remember that it will take years of training to get to my ninja (0.2162 seconds) level.
http://www.bbc.co.uk/science/humanbody/sleep/sheep/reaction_version5.swf
Officially the Ninjas of 9BK are Gabriel Measure 0.1866 seconds and Paea Toki 0.1804 seconds. These guys are officially legends.
Thursday, July 31, 2014
Statistics Post 2
Interpreting Data From Articles/Table and Graphs
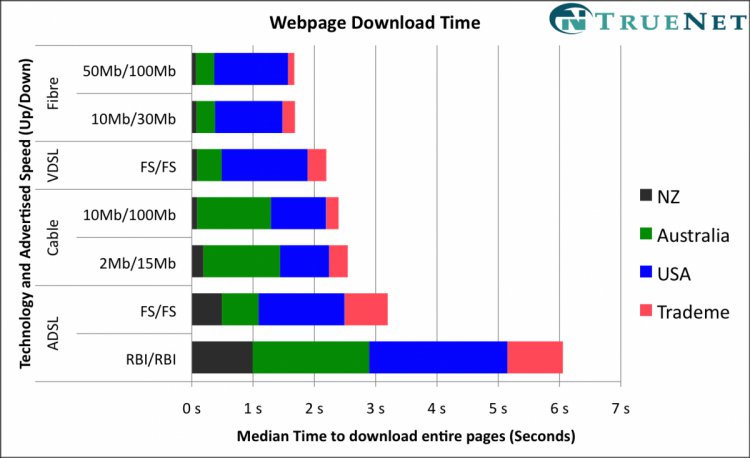
A skill that we all need in modern day life is to avoid being tricked. Often people that are selling products or ideas will try and trick you using Statistics.

Advertisers know that the typical consumer (that's you and me) can get tricked. The more complicated the data the trickier it gets.
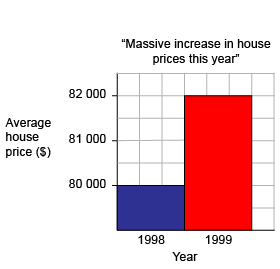
With the election campaign happening every three years in New Zealand it is very common for politicians to try and trick voters...

 Take some time to look at this graph. Can you see what is not right about this? What was trying to be achieved here? Who do you think created this graph/advertisement?
Here is another... this shows you how complicated data can hide some silly ideas. Can you see the trick here?
Now we can work from the textbook - page 392 to 394 this is on reading data tables or some pie graphs.
A skill that we all need in modern day life is to avoid being tricked. Often people that are selling products or ideas will try and trick you using Statistics.
Advertisers know that the typical consumer (that's you and me) can get tricked. The more complicated the data the trickier it gets.
With the election campaign happening every three years in New Zealand it is very common for politicians to try and trick voters...
Take some time to look at this graph. Can you see what is not right about this? What was trying to be achieved here? Who do you think created this graph/advertisement?Here is another... this shows you how complicated data can hide some silly ideas. Can you see the trick here?
Now we can work from the textbook - page 392 to 394 this is on reading data tables or some pie graphs.
Statistics Post 1
Intro to Statistics
Statistics is the most vital of all the areas of Mathematics (most students that do senior maths do it in Statistics). Statistics is the most common paper taken at Universities in NZ (compulsory for Law, Business, Architecture, Medicine, Marketing degrees).
It is a relatively new piece of mathematics (grown with the use of computers – especially spread sheets). This is because computers can 'crunch' heaps of numbers. Imagine trying to add up manually the weights of every student here at Waihi College - it would literally take hours.
 Medicine
– statistics have helped us find causes (and often cures) for diseases. e.g. the trend of death for smokers. Here is an advert that was used when smoking companies tried to say smoking was good for your health.
Medicine
– statistics have helped us find causes (and often cures) for diseases. e.g. the trend of death for smokers. Here is an advert that was used when smoking companies tried to say smoking was good for your health.
 Sometimes statistics can trick us into wrong thinking about the relationships between (hard to prove scientifically) driving seatbelts and death. See if you take 100 road deaths probably 90 of them would have their seatbelts on. It would be wrong to assume seatbelt were the cause.
We have to start somewhere and in Statistics we start with the actual numbers. Mathematicians give a name to numbers "Data". Data is not as easy as we think.
Sometimes statistics can trick us into wrong thinking about the relationships between (hard to prove scientifically) driving seatbelts and death. See if you take 100 road deaths probably 90 of them would have their seatbelts on. It would be wrong to assume seatbelt were the cause.
We have to start somewhere and in Statistics we start with the actual numbers. Mathematicians give a name to numbers "Data". Data is not as easy as we think.

Statistics is the most vital of all the areas of Mathematics (most students that do senior maths do it in Statistics). Statistics is the most common paper taken at Universities in NZ (compulsory for Law, Business, Architecture, Medicine, Marketing degrees).
It is a relatively new piece of mathematics (grown with the use of computers – especially spread sheets). This is because computers can 'crunch' heaps of numbers. Imagine trying to add up manually the weights of every student here at Waihi College - it would literally take hours.
Medicine
– statistics have helped us find causes (and often cures) for diseases. e.g. the trend of death for smokers. Here is an advert that was used when smoking companies tried to say smoking was good for your health. Sometimes statistics can trick us into wrong thinking about the relationships between (hard to prove scientifically) driving seatbelts and death. See if you take 100 road deaths probably 90 of them would have their seatbelts on. It would be wrong to assume seatbelt were the cause.
There are two main types of data -
- Counted data (discrete data) these are always whole numbers (no decimals). Say if I asked how many times a group of people went to the movies last year - I would expect to get answer like "none", "five", "three" etc... I shouldn't expect to get an answer like "two and a quarter (2.25)".
- Measured data (continuous data) these are when we do get decimals. Say if I asked how many minutes was your last phone call - I would expect answers like "three and a half" or "ten minutes and twenty seconds" etc.
Wednesday, July 23, 2014
Geometry Angles Post 10
Three Dimensional Shapes
It is a real talent to see/draw 3D shapes on a flat piece of paper.
This years course is about your ability to name the main 3D shapes.
Here are the main types of 3D shapes that we can name the most common shapes.

It is a real talent to see/draw 3D shapes on a flat piece of paper.
This years course is about your ability to name the main 3D shapes.
Here are the main types of 3D shapes that we can name the most common shapes.
The shapes in order are...
- Sphere (note a half a sphere is called a 'hemisphere').
- Pyramid (note this is a triangle based pyramid).
- Cuboid (it is mathematically incorrect to say 'box').
- Cylinder
- Cube
- Cone.
Tuesday, July 22, 2014
Geometry Angles Post 9
Angles on Parallel Lines
Parallel lines are lines that never cross because they are travelling in the same direction. We use
arrows on the lines to represent parallel lines.
Perpendicular lines cross at 90 degrees (not needed but interesting).
Parallel lines are particularly good at creating interesting math problems especially when they combine with our previous geometry rules (angles inside triangles, angles at a point, angles on a straight line or vertically opposite angles are equal).
The main ways that angles can form on parallel lines is if we have a line that crosses over the parallel lines (a transversal). Then we can form the three main types of angles on parallel lines...
The work for angles on straight lines can be found on pages 253 - 272 Exercises 18.1 to 18.7.
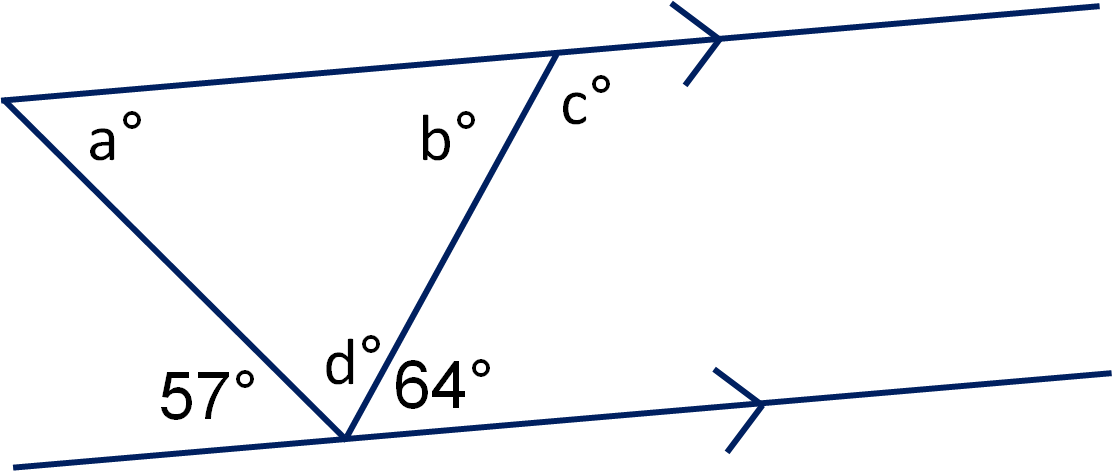
Can you see how each of the angles a, b, c, and d can be calculated using our geometry rules?
Parallel lines are lines that never cross because they are travelling in the same direction. We use
arrows on the lines to represent parallel lines.
 |
| railway lines never touch |
Perpendicular lines cross at 90 degrees (not needed but interesting).
Parallel lines are particularly good at creating interesting math problems especially when they combine with our previous geometry rules (angles inside triangles, angles at a point, angles on a straight line or vertically opposite angles are equal).
 |
| parallel lines |
The main ways that angles can form on parallel lines is if we have a line that crosses over the parallel lines (a transversal). Then we can form the three main types of angles on parallel lines...
- Corresponding Angles (are equal),
- Co-interior Angles (add to 180), and,
- Alternative Angles (are equal).
 |
| See all the parallel lines. |
The work for angles on straight lines can be found on pages 253 - 272 Exercises 18.1 to 18.7.
Can you see how each of the angles a, b, c, and d can be calculated using our geometry rules?
Subscribe to:
Posts (Atom)